When a modern, million-dollar greenhouse relies on just 2-4 temperature and humidity sensors, crops live with immense climatic uncertainty. New-generation distributed sensor networks are revealing that even in advanced greenhouses, internal microclimate differences can cause 30% yield fluctuations—and the solution may cost less than you think.
Yield Loss Hidden by Average Temperatures
In early 2024, researchers from Wageningen University deployed 128 temperature and humidity sensors in a single commercial tomato greenhouse in the Netherlands and monitored them for three months. The results were startling: in an environment that the official control system showed as “perfectly stable,” horizontal temperature differences reached up to 5.2°C, vertical differences 7.8°C, and humidity varied by over 40% RH. Crucially, these “microclimate pockets” directly mapped to yield patterns—plants in persistently warmer zones produced 34% less than those in ideal zones.
1: The Three Cognitive Traps of Traditional Greenhouse Monitoring
1.1 The Myth of the “Representative Location”
Most greenhouses hang sensors 1.5-2 meters above walkways, but this location:
Is far from the canopy: Temperature can differ from the actual crop environment by 2-4°C.
Is affected by ventilation: Overly influenced by airflow from entrances.
Suffers from lag: Responds to environmental changes 10-30 minutes slower than the canopy.
1.2 The Collapse of the Uniformity Assumption
Even the most advanced Dutch Venlo-type greenhouses develop significant gradients due to:
Sun path: East-west temperature differences can reach 4-6°C on sunny afternoons.
Hot air pooling: The highest point at the roof can be 8-12°C warmer than the floor.
Humidity cold traps: Corners and low areas often exceed 90% RH, becoming breeding grounds for disease.
1.3 The Blind Spot for Dynamic Responses
Traditional systems miss key transient events:
Morning curtain-opening shock: Local temperature can drop 3-5°C in 10 minutes.
Post-irrigation microclimate: Humidity around drip points instantly rises 25-35% RH.
Crop respiration effects: Dense canopy interiors deplete CO₂ and become abnormally warm in the afternoon.
Part 2: The Deployment Revolution of Multi-Probe Systems
2.1 Economical Grid Solutions (For Small-Scale Growers)
The “Nine-Square Grid” Basic Layout (for greenhouses under 500m²):
text
Cost: $300-$800 | Number of probes: 9-16 | Payback period: <8 months Deployment essentials: • Three-dimensional coverage (low/middle/high levels) • Focus monitoring: corners, entrances, near heating pipes • At least 2 probes must be at crop canopy height Data application: • Generate daily/weekly temperature distribution heatmaps • Identify persistent problem zones (e.g., constant high humidity) • Optimize start/stop logic for ventilation, heating, shading
2.2 Professional High-Density Solutions (Commercial Production)
Case Study: “Per-Rack Monitoring” in a Strawberry Greenhouse (Netherlands, 2023):
Density: 24 probes deployed per 100-meter-long cultivation rack.
Findings:
A consistent 3-4°C difference between rack ends caused a 7-day maturity gap.
Middle rack humidity was 15-20% higher than top/bottom, tripling grey mold incidence.
Dynamic Response:
Independent ventilation control per rack section.
Heating triggered based on actual fruit-zone temperature, not air temperature.
Results:
Yield consistency improved by 28%.
Grade A fruit rate increased from 65% to 82%.
Fungicide use reduced by 40%.
2.3 “Climate Sculpting” in Vertical Farms
Data from Singapore’s Sky Greens Project:
6 probes deployed per level on a 12-tier rotating rack system (72 total).
Revelatory Insight:
Rotation doesn’t uniformly mix climate but creates periodic shocks.
Plants experience 2.5-3.5°C fluctuations per 8-hour rotation cycle.
Precision Adjustment:
Different temperature/humidity targets set for different levels.
Predictive adjustment of LED light intensity based on rotation phase.
Part 4: Quantified Economic Benefit Analysis
4.1 Return on Investment for Different Crops
Based on data from 23 commercial greenhouses in Europe (2021-2023):
| Crop Type | Typical Probe Density | Incremental Investment | Annual Profit Increase | Payback Period |
|---|---|---|---|---|
| High-value berries | 1 per 4m² | $8,000/ha | $18,000/ha | 5.3 months |
| Tomatoes/Cucumbers | 1 per 10m² | $3,500/ha | $7,200/ha | 5.8 months |
| Leafy greens | 1 per 15m² | $2,200/ha | $4,100/ha | 6.5 months |
| Ornamental plants | 1 per 20m² | $1,800/ha | $3,300/ha | 6.6 months |
Profit Composition Analysis (Tomato Example):
- Yield increase contribution: 42% (direct from microclimate optimization).
- Quality premium: 28% (higher proportion of Grade A fruit).
- Input savings: 18% (precise water, fertilizer, pesticide use).
- Energy reduction: 12% (avoiding over-control).
4.2 Risk Mitigation Value
Quantifying economic value during extreme weather events:
- Heatwave warning: Early detection of “hotspots” for targeted cooling, preventing local heat damage.
- Case: 2023 French heatwave, multi-probe greenhouse losses <$500/ha vs. traditional greenhouse average loss of $3,200/ha.
- Frost defense: Precisely identify coldest points, activate heating only when/where necessary.
- Energy saving: 65-80% less fuel compared to whole-greenhouse heating.
- Disease prevention: Early warning for high-humidity zones, preventing spread.
- Value: Preventing a single large-scale botrytis outbreak saves $1,500-$4,000/ha.
Part 5: Technological Evolution & Future Trends
5.1 Sensor Technology Breakthroughs (2024-2026)
1. Self-powered wireless probes
- Harvesting energy from light and temperature differences inside the greenhouse.
- Dutch company PlantLab’s prototype achieves permanent operation.
2. All-in-one micro probes
- 2cm x 2cm module integrates: Temp/Humidity, Light, CO₂, VOCs, Leaf Wetness.
- Cost target: <$20 per point.
3. Flexible distributed sensing
- Like a “climate-sensing film” covering the entire greenhouse surface.
- Can detect solar radiation absorption differences per square meter.
5.2 Integration & Data Analysis
Digital Twin Greenhouse
- Map real-time data from hundreds of probes to a 3D greenhouse model.
- Simulate the effects of any adjustment (window opening, shading, heating).
- Predict impact of different strategies on yield and quality.
Blockchain Traceability Enhancement
- Complete growth-climate record for every batch of produce.
- Provides immutable evidence for “climate-certified” products.
- Can command 30-50% premium in high-end markets.
5.3 Global Adaptation & Innovation
Solutions for tropical, low-resource environments (Africa, Southeast Asia):
- Solar-powered probes using mobile tower networks for power.
- Low-cost LoRa networks covering 5km ranges.
- Sending critical alerts to farmers via SMS.
- Pilot project (Kenya) results: smallholder yield increases of 35-60%.
Part 6: Implementation Guide & Pitfalls to Avoid
6.1 Phased Deployment Strategy
Phase 1: Diagnosis (1-4 weeks)
- Goal: Identify biggest problems and differential zones.
- Equipment: 16-32 portable probes, temporary deployment.
- Output: Heatmaps, problem zone list, prioritized action plan.
Phase 2: Optimization (2-6 months)
- Goal: Address most severe microclimate issues.
- Actions: Data-informed adjustments to ventilation/shading/heating.
- Monitoring: Assess improvement, quantify benefits.
Phase 3: Automation (After 6 months)
- Goal: Achieve closed-loop automatic control.
- Investment: Permanent probe network + actuators + control algorithms.
- Integration: Connect to existing greenhouse control system.
6.2 Common Pitfalls & Solutions
Pitfall 1: Data overload, no actionable insight.
- Solution: Start with 3 key metrics—canopy temperature uniformity, vertical temperature difference, humidity hotspots.
- Tool: Auto-generate a “Daily Health Report” highlighting only anomalies.
Pitfall 2: Incorrect probe placement.
- Golden rule: Probes should be within the plant canopy, not above walkways.
- Check: Regularly (monthly) verify if probe positions have changed due to plant growth.
Pitfall 3: Neglecting calibration drift.
- Protocol: On-site calibration with a mobile reference unit every 6 months.
- Technique: Use cross-validation within the probe network to auto-flag anomalous probes.
6.3 Skill Development & Knowledge Transfer
Core competencies for the new greenhouse technician:
- Data literacy: Interpreting heatmaps, time-series graphs.
- Climate diagnosis: Inferring causes from abnormal patterns (e.g., east-side morning overheating = insufficient shading).
- Systems thinking: Understanding interactions between ventilation, heating, shading, irrigation.
- Basic programming: Ability to adjust control algorithm parameters.
Conclusion:
Multi-probe temperature and humidity monitoring represents not just technological progress, but an evolution in agricultural philosophy—from pursuing uniform control parameters to understanding and respecting the natural heterogeneity of crop micro-environments; from reacting to environmental changes to actively shaping the climate trajectory experienced by each plant.
When we can provide each plant with the climate it truly needs, not just the greenhouse average, the true era of precision agriculture has arrived. Multi-probe temperature and humidity sensors are the key to unlocking this era—they let us “hear” the subtle whispers of environmental needs from every leaf and fruit and, finally, learn to respond with data-driven wisdom.
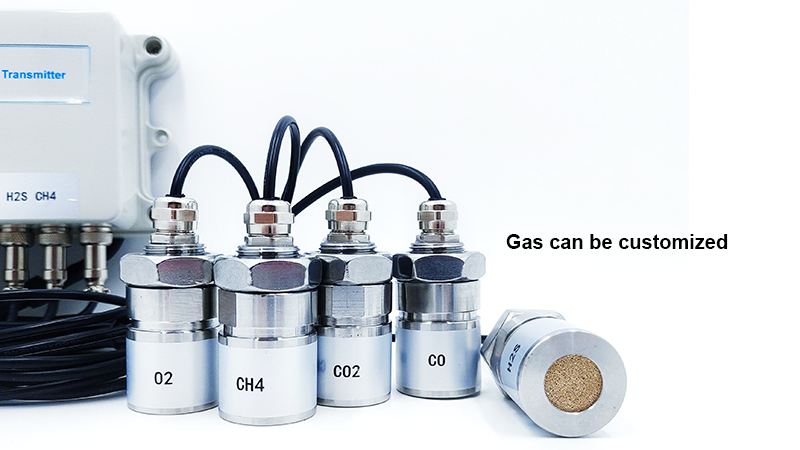
Complete set of servers and software wireless module, supports RS485 GPRS /4g/WIFI/LORA/LORAWAN
For more gas sensors information,
please contact Honde Technology Co., LTD.
Email: info@hondetech.com
Company website: www.hondetechco.com
Tel: +86-15210548582
Post time: Dec-23-2025