

The water quality monitoring systems market is set to expand from USD 6.51 billion in 2026 to USD 11.68 billion by 2034, a 7.59% CAGR. The headline, however, conceals the more interesting development: the fastest-growing installations are no longer inside climate-controlled laboratories. They stand on coastal outfalls, tropical well pads, humid riverbanks and corrosive chemical parks, where salt spray, elevated temperature and humidity near 95% quietly retire ordinary instrumentation within months.
That is the environment the MPG-6099 / MPG-6099Plus multiparameter water quality analyzer was built for: a single integrated cabinet, up to eight RS485 Modbus digital sensors, and live readings pushed to a phone, a SCADA screen or a cloud dashboard. This report examines the 2026 numbers, the new “climate-ready” buying criteria, the full monitoring stack, and how high-demand developed markets — the United States, Germany, Japan and South Korea — are actually deploying it.
1.1 Global water quality monitoring systems market
| Year | Global market | Status |
|---|---|---|
| 2025 | USD 6.09 billion | Base year |
| 2026 | USD 6.51 billion | Estimated |
| 2034 | USD 11.68 billion | Forecast |
| CAGR 2026–2034 | 7.59% | — |
1.2 Where the money sits: regional and national markets
| Market | 2025 value | Global share | 2026 value |
|---|---|---|---|
| Asia Pacific | USD 1.87 B | 30.71% | — |
| North America | USD 1.86 B | — | USD 1.97 B |
| — United States | USD 1.55 B | 25.49% | — |
| Europe | USD 1.34 B | — | +5.98% growth |
| — Germany | USD 0.36 B | 5.87% | USD 0.38 B |
| — Japan | USD 0.22 B | 3.69% | — |
| China | USD 0.67 B | 10.97% | — |
| India | USD 0.37 B | 6.15% | — |
| Brazil | USD 0.28 B | 4.55% | — |
| GCC | USD 0.20 B | 3.25% | — |
A separate report using a wider market definition places North America at 38%, Europe 31% and Asia-Pacific 27% (Business Research Insights); the gap reflects different scope, not a contradiction.
1.3 Chart A — 2025 market value by region and country (USD billion)
Asia Pacific   |████████████████████████████████████████| 1.87
North America  |████████████████████████████████████████| 1.86
United States  |█████████████████████████████████| 1.55
Europe         |████████████████████████████| 1.34
China          |██████████████| 0.67
India          |████████| 0.37
Germany        |████████| 0.36
Brazil         |██████| 0.28
Japan          |█████| 0.22
GCC            |████| 0.20
1.4 The layer that is accelerating fastest
While sensors and probes still hold the largest component share and industrial end users dominate, the bottleneck has moved to connectivity. Data acquisition & transmission systems are the fastest-growing component segment, at an 8.94% CAGR, and portable deployment is growing at 8.33% (Fortune Business Insights). In short: buying a sensor is table stakes; getting its data off-site reliably is where budgets are now being tested.
2. Why “Anti-Corrosion, Climate-Ready” Overtook Raw Accuracy as the Deciding Spec
A precise sensor that drifts after three months in salt air is not precise in practice. Industry analysis identifies the leading challenge for the category as maintaining data reliability in diverse conditions over time — biofouling, temperature swings, chemical interference and sediment build-up all degrade readings and force recalibration
That is why accuracy alone no longer clears a 2026 shortlist. Across harsh-site deployments, buyers increasingly weigh three environmental clauses alongside it: corrosion resistance, wide operating temperature, and high-humidity tolerance. The difference is measurable. In a documented deployment, a comparison system suffered three display failures a year in a humid tropical site, while a 316L stainless-steel, IP68-rated build rated for −20°C to 70°C and 95% humidity ran without interruption
| Environment | What attacks the instrument | Spec that answers it |
|---|---|---|
| Coastal / offshore outfalls | Salt spray, chloride corrosion | 316L stainless-steel housing, IP68 sealing |
| Tropical well pads & rivers | 90%+ humidity, 40°C+ heat | −20°C to 70°C range, 95% RH tolerance |
| Chemical & petrochemical parks | Acid/alkali effluent, H₂S fumes | Anti-corrosion cabinet, sealed electronics |
| Mining & metallurgy | Abrasive slurry, sediment | Self-cleaning / anti-biofouling sensor design |
| Cold-region municipal WWTPs | Sub-zero winters | Wide low-temperature operating range |
In short: the cabinet is no longer a passive box — it is the first line of compliance defence.
3. The Complete Monitoring Stack: Three Building Blocks Buyers Now Specify
A 2026-grade online analyzer is not one device; it is a three-layer architecture. The MPG-6099 platform supports each layer natively, so buyers can specify continuous monitoring without stitching together three vendors.
3.1 Handmeter and Data Logger with Screen
- Handheld meter (handmeter) for field spot-checks, sensor verification and calibration rounds — the reference value that keeps online readings honest.
- On-board data logger with a 7-inch colour touch screen, storing measurements locally (128M storage) with USB-to-Excel export for audits and regulatory submissions.
- Reads all parameters on one screen with live and historical curves, so operators trend process behaviour instead of reading isolated snapshots.
Why it matters: regulators and auditors accept continuous, timestamped records — not a technician’s notebook. On-site logging plus a portable meter closes the traceability gap.
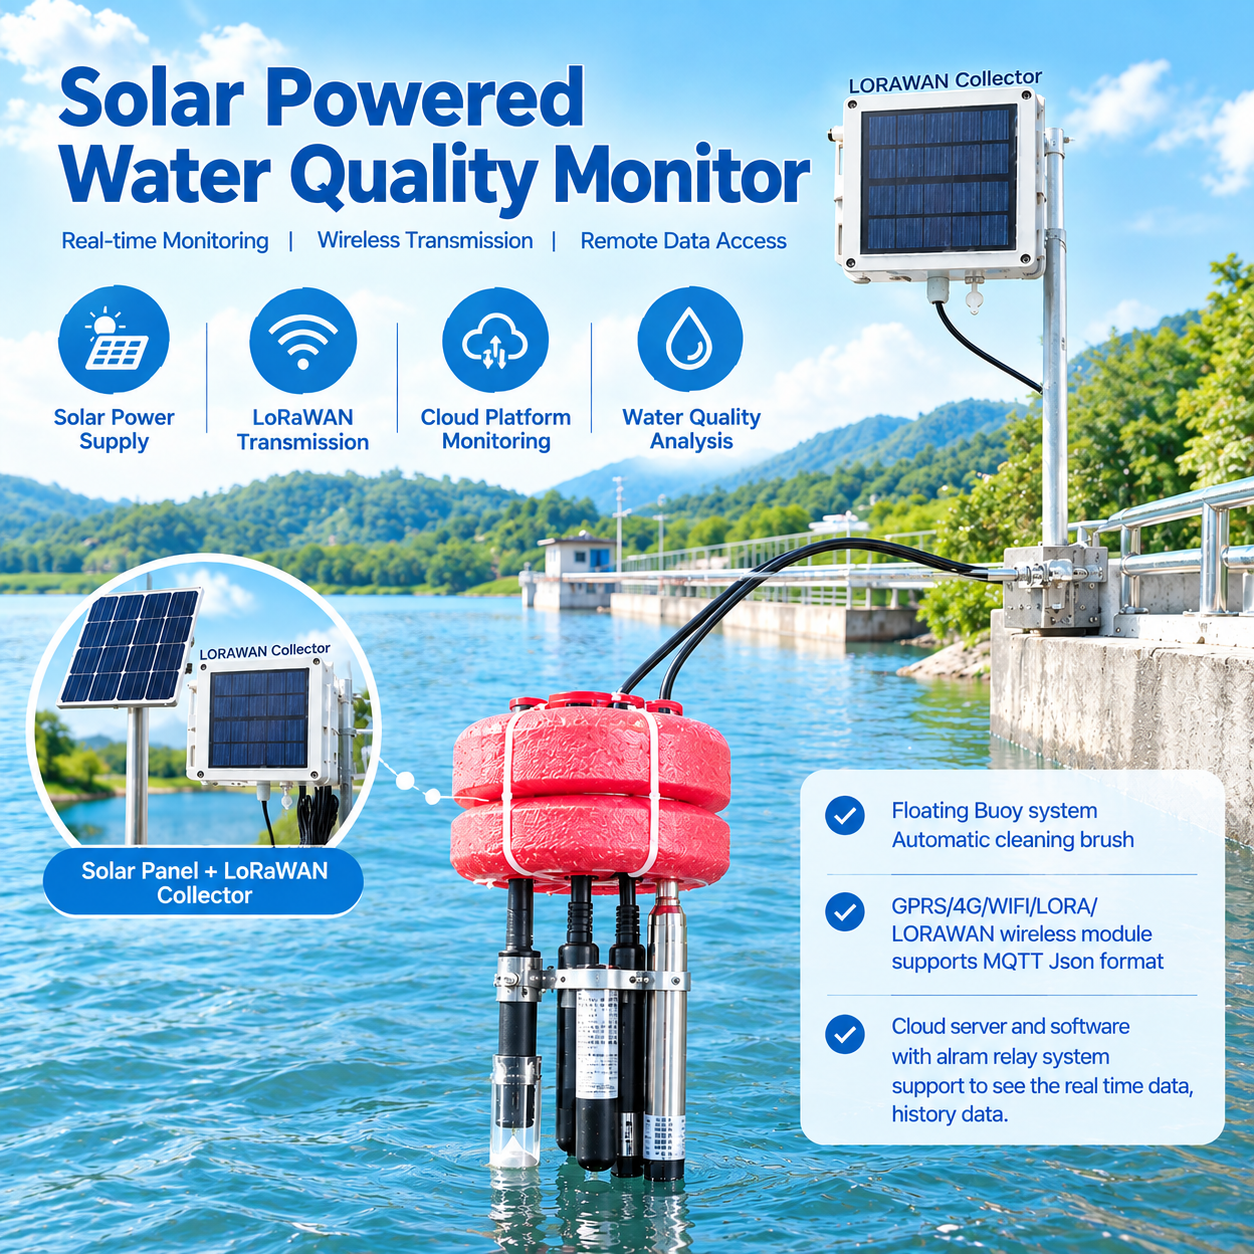
3.2 GPRS / 4G / WiFi / LoRa / LoRaWAN Wireless Module (MQTT JSON)
- The cabinet’s second RS485 port can be configured for a wireless module, so one unit covers both wired SCADA and remote telemetry.
- Supported bearers: GPRS / 4G / WiFi / LoRa / LoRaWAN, matching the site — 4G where bandwidth and public coverage matter, LoRa / LoRaWAN for low-power, long-range, battery-friendly river and reservoir stations, WiFi for plants with an existing LAN.
- Data format: MQTT JSON, the lightweight, machine-readable payload that drops straight into SCADA, PLC, dashboards and third-party IoT platforms without custom drivers.
Why it matters: MQTT JSON makes the analyzer vendor-neutral at the data layer. Integrators connect it to a national compliance platform, a utility historian, or a private dashboard with minimal engineering.
3.3 Cloud Server and Software with Alarm Relay (Real-Time and History Data)
- Cloud server + software presenting real-time data and history data from every connected site on one dashboard.
- Alarm relay outputs that do more than blink a light: relay contacts can drive dosing pumps, valves, sirens or shutdown circuits the moment a threshold is breached.
- Multi-site management, threshold configuration and exportable compliance reports for municipal and industrial portfolios.
Why it matters: monitoring becomes control. Alarmed relays turn a reading into an action — a response loop that manual sampling simply cannot match.
| Stack layer | What it does | Buyer benefit |
|---|---|---|
| Handmeter & data logger (screen) | Local reference measurement + on-board logging & export | Audit-ready records, field verification |
| Wireless module (GPRS/4G/WiFi/LoRa/LoRaWAN, MQTT JSON) | Sends measurements to gateway, server or cloud | Remote visibility, vendor-neutral integration |
| Cloud software + alarm relay | Real-time & history dashboards, threshold alarms, relay control | Compliance automation, faster incident response |
4. Product Snapshot: What the MPG-6099 / MPG-6099Plus Actually Delivers
The platform consolidates the measurement stack into one wall-mounted cabinet that can be configured to the buyer’s ordered parameters.
| Specification | Detail |
|---|---|
| Housing & protection | Wall-mounted cabinet; IP65 standard build, with a 316L stainless-steel IP68 option for harsh sites (ambient operating range −20°C to 70°C, 95% RH) |
| Dimensions | 320 mm × 270 mm × 121 mm |
| Display | 7-inch colour touch screen |
| Data logger | 128M on-board storage; USB / Excel download |
| Power | 24 VDC or 220 VAC |
| Sensor input | RS485 Modbus, up to 8 digital sensors |
| Output | 2 × RS485 Modbus, or 1 × RS485 + 1 × wireless module |
| Measurable parameters | pH (0–14), ORP (±2000 mV), conductivity (0–2000 mS/cm), dissolved oxygen (0–20 mg/L), turbidity (0–3000 NTU), suspended solids (0–12000 mg/L), COD (0–1000 mg/L), measured water temperature (0–50°C), plus ammonia nitrogen (NH₃-N), nitrate (NO₃-N), colour, chloride, and ion-selective probes |
| Extended platform (6099Plus) | Adds BOD, TOC, blue-green algae, chlorophyll, oil-in-water and ISE sensors (NH₄⁺, NO₃⁻, Ca²⁺, F⁻, K⁺, Cl⁻) |
Selling points mapped to buyer pain points
| Buyer concern | How the analyzer answers it |
|---|---|
| Sensors drift or fail in humid / corrosive sites | IP65 standard, IP68 316L option; rated −20°C to 70°C and 95% RH |
| Audits demand continuous records, not spot samples | On-board 128M logger + USB/Excel export, timestamped |
| Several single-parameter meters mean high capex and calibration load | One cabinet integrates pH, DO, COD, ammonia and more on RS485 Modbus |
| Remote sites are costly to staff | 4G/WiFi/LoRa/LoRaWAN telemetry with MQTT JSON to cloud |
| Compliance scope keeps widening | Modular platform extends to nitrate, TSS, chlorophyll, ISE and more |
| A reading alone does not stop an excursion | Cloud alarm relay outputs can trigger pumps, valves and alarms |
5. Where Demand Is Rising: A Country-by-Country Read
Developed markets dominate spend, and each carries a distinct regulatory trigger.
| Country | Market signal | Primary demand driver |
|---|---|---|
| United States | USD 1.55 B in 2025, 25.49% of global | EPA enforcement + massive infrastructure renewal |
| Germany | USD 0.36 B (2025) → USD 0.38 B (2026), 5.87% global | EU directives, industrial discharge control, circular water |
| Japan | USD 0.22 B in 2025, 3.69% global | Smart water modernisation; >90% wastewater treatment rate |
| South Korea | Online analyzer market USD 0.22 B (2025) → USD 0.35 B (2033), ~6.1% CAGR | Green New Deal, smart-city IoT water networks |
| United Kingdom / France | Inside Europe’s USD 1.34 B, +5.98% growth | EU Water Framework & Drinking Water Directives |
| Canada / Australia | Inside North America / Asia-Pacific totals | Federal standards, mining and coastal monitoring |
Note: the South Korea figure covers the narrower online water quality analyzer segment, whereas the United States, Germany and Japan figures cover the total water-quality monitoring systems market. Treat them as directional indicators rather than directly comparable numbers.
Chart B — Global market trajectory (USD billion)
2034  |████████████████████████████████████████| 11.68
2026  |██████████████████████| 6.51
2025  |█████████████████████| 6.09
The policy engines behind the numbers
- United States. The Infrastructure Investment and Jobs Act channels more than
50billion∗∗intodrinkingwater,wastewaterandwaterreuse([USEPA](https://www.epa.gov/infrastructure/infrastructure−investment−and−jobs−act−resources−clean−water)),againstanestimated∗∗271 billion wastewater infrastructure funding gap .EPA’s FY2026 water infrastructure programs are funded at
3.04billion∗∗([EveryCRSReport,Mar2026](https://www.everycrsreport.com/reports/IF13177.html)),andtheClean/DrinkingWaterSRFprogramshavealreadyprovided∗∗over265 billion across roughly 76,000 projects . PFAS MCL compliance now touches about 66,000 water systems .
- European Union. The recast Urban Wastewater Treatment Directive tightens treatment and monitoring obligations, mandating extended nutrient removal and stricter micropollutant limits.
- Japan. With more than 90% of wastewater treated, the focus moves from coverage to precision and digital modernisation .
- South Korea. Government smart-city and Green New Deal programmes push IoT and AI into urban water management, driving deployment of sensor networks in rivers, industrial zones and treatment plants .
6. Application Case Scenarios in High-Demand Developed Markets
The scenarios below reflect typical 2026 deployments in the largest developed markets, applying the same three-layer stack described in Section 3.
Scenario A — Germany: industrial effluent at a chemical park
- Challenge: mixed chemical discharge with tight COD and ammonia limits; corrosive fumes and variable temperature.
- Configuration: pH, ORP, conductivity, turbidity, COD and ammonia-nitrogen sensors on RS485 Modbus in an anti-corrosion cabinet.
- Stack: handmeter for field verification plus an on-board logger with screen for shift-level checks; 4G + MQTT JSON telemetry to the operator’s SCADA; cloud dashboard with alarm relay wired to a neutralisation dosing pump.
- Outcome: continuous, audit-ready effluent records and automatic corrective dosing — the pattern European operators need under tightening EU directives.
Scenario B — Japan: municipal wastewater nutrient removal
- Challenge: ageing plants chasing precise nitrogen and phosphorus control, with coastal humidity at many sites.
- Configuration: DO, pH, turbidity, TSS and ammonia sensors; IP68 316L stainless build for salt-exposed nodes.
- Stack: handmeter for field verification plus an on-board data logger with screen; LoRaWAN for low-power remote manholes and WiFi inside the plant; cloud history data for trend reporting; alarm relay to aeration blowers.
- Outcome: tighter aeration control, lower energy use, and continuous compliance evidence for a >90%-treated national network.
Scenario C — United States: municipal utility modernisation
- Challenge: legacy plants with an EPA-driven upgrade cycle and expanding monitoring scope (COD, ammonia, PFAS-adjacent parameters).
- Configuration: multiparameter cabinet at the outfall; COD, ammonia, DO, pH and TSS sensors.
- Stack: handmeter for field verification; 4G MQTT JSON feed into the utility historian; cloud platform consolidating multiple sites with relay-triggered alarms.
- Outcome: one dashboard replacing scattered single-parameter meters — aligned with the SRF-funded modernisation wave.
Scenario D — South Korea: smart-city river and industrial-zone networks
- Challenge: dense urban rivers and industrial zones needing real-time, city-wide water visibility.
- Configuration: modular analyzers at distributed monitoring points; configurable parameter sets per node.
- Stack: handmeter and on-board data logger with screen at each node; LoRa/LoRaWAN + 4G hybrid connectivity; MQTT JSON into a smart-city platform; cloud alarm relay for rapid incident response.
- Outcome: an integrated IoT water network consistent with national green-tech programmes.
Reference deployment — proven in the field (Indonesia oil & gas)
The most thoroughly documented real-world proof point remains an Indonesian oil-and-gas producer running 23 onshore platforms and 11 offshore facilities. After switching to the MPG-6099, the operator reported:
| Metric | Result |
|---|---|
| Harsh-climate reliability | 316L stainless-steel, IP68, −20°C to 70°C, 95% RH; 0 display failures vs 3/year on the incumbent |
| Regulatory compliance | e-Proper audit pass rate up from 82% → 100% |
| Fine exposure avoided | Up to USD 25,000/day in potential penalties |
| Operational efficiency | +60% |
| Chemical savings | −18% water-treatment chemicals, ≈ USD 450,000/year |
| Repeat order | 36 systems deployed, then +15 units and referrals to a national operator |
7. The Bottom Line
Three forces now converge on the same purchase decision. Regulation is making continuous, logged measurement mandatory — from EPA enforcement and SRF-funded upgrades in the United States to the recast EU wastewater directive, Japan’s precise-treatment agenda and South Korea’s smart-city programmes. Environment is punishing instruments that cannot survive heat, humidity and corrosion, which is why anti-corrosion, IP68-rated builds now win on total cost of ownership. And connectivity has become the value layer: with MQTT JSON telemetry and cloud alarm relays, an analyzer stops being a gauge and becomes a control loop.
For exporters, integrators and plant operators planning a 2026–2027 upgrade, the configuration that ages best is the one that arrives complete: an anti-corrosion cabinet, RS485 Modbus sensors, a handheld-and-logger pairing, multi-bearer wireless with MQTT JSON, and a cloud platform with real-time data, history data and alarm relay control.
Talk to our engineers about a parameter configuration and a site-specific quotation for the IoT multiparameter water quality analyzer.
For more sensor information, please contact Honde Technology Co., LTD.
- WhatsApp: +86-15210548582
- Email: info@hondetech.com
- Company Website: www.hondetechco.com
Post time: Sep-16-2026