

From Manual Sampling to Continuous Oxygen Intelligence
In Tasmania’s remote Macquarie Harbour, dissolved oxygen is more than a water-quality parameter.
It can directly influence aquaculture operations, environmental reporting, feeding decisions, and licence compliance.
Macquarie Harbour is a semi-enclosed estuary on Tasmania’s west coast. Its deep basin, limited water exchange, seasonal stratification, freshwater inflows and high organic loading create challenging conditions for salmon farming.
For operators working in this environment, occasional manual sampling is no longer enough.
What is needed is a monitoring system that can continuously answer four critical questions:
What is the oxygen level now?
Where is it changing?
Why is it changing?
What should the farm do when oxygen drops?
This is where an integrated Optical Dissolved Oxygen + Multi-Parameter Water Quality + LoRaWAN + Cloud Monitoring architecture can create value.
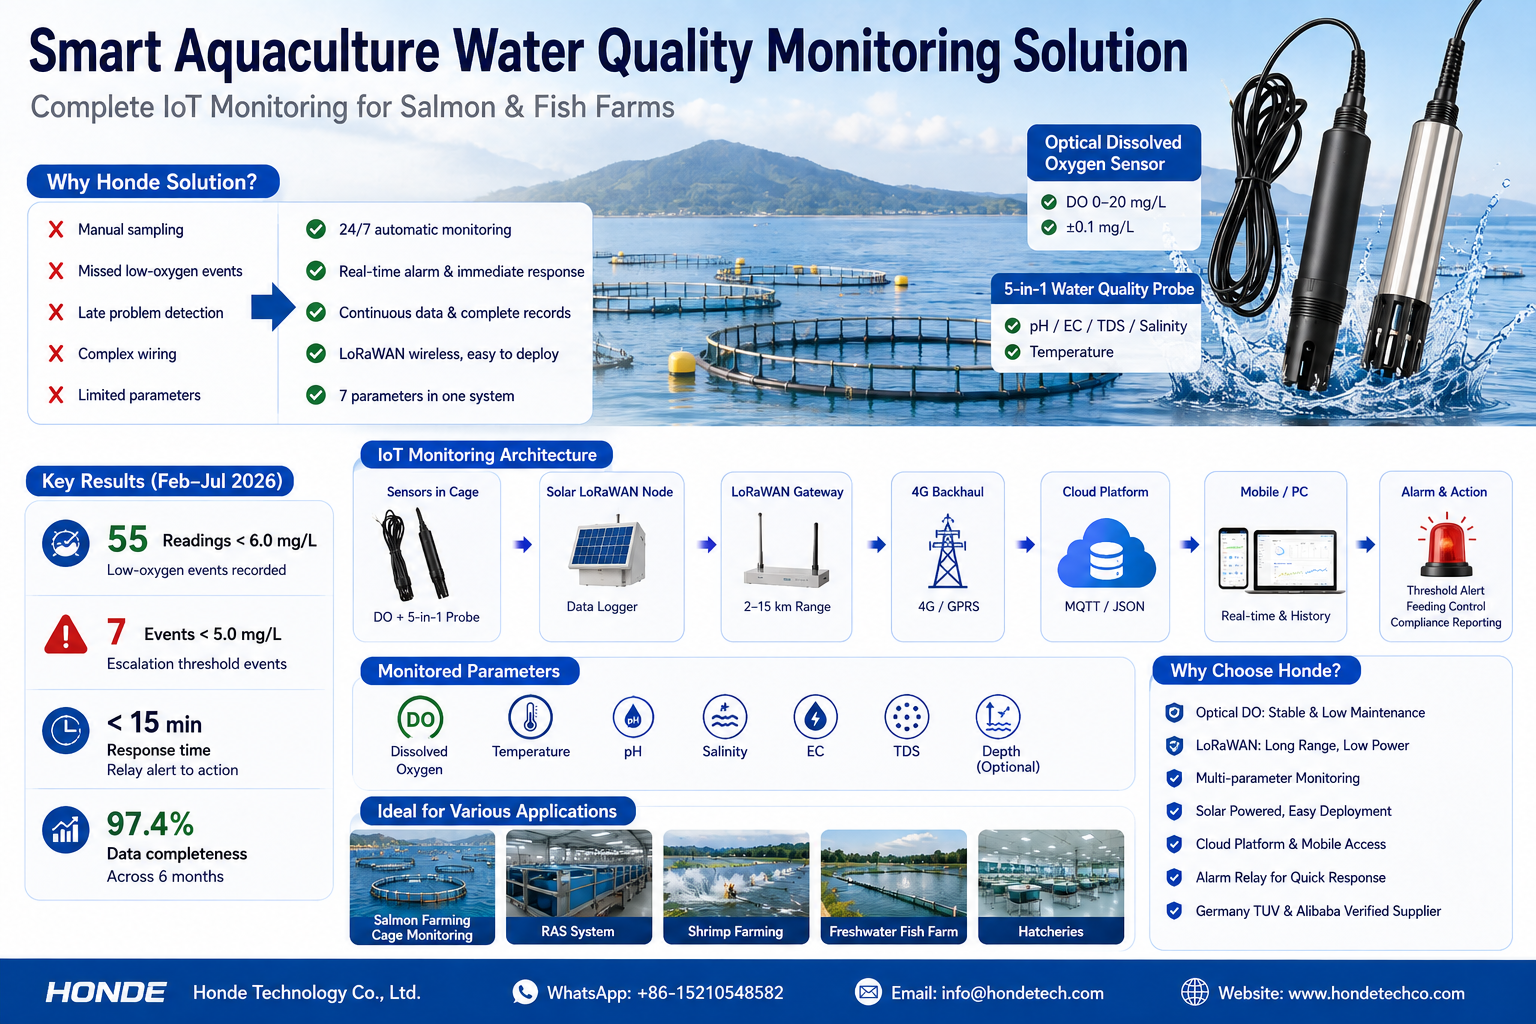
01 | Why Dissolved Oxygen Has Become a Critical Aquaculture KPI
In intensive salmon farming, oxygen conditions can change rapidly with weather, water stratification, biomass, feeding activity and organic loading.
A sensor that only provides occasional readings may miss short-duration oxygen excursions.
Continuous monitoring changes the equation.
Key Monitoring Challenges
| Challenge | Traditional Approach | Continuous IoT Monitoring |
|---|---|---|
| DO measurement | Manual sampling | 24/7 automated measurement |
| Data frequency | Periodic | 15-minute or customized interval |
| Remote cages | Difficult to access | Wireless transmission |
| Low-oxygen event | Detected after sampling | Real-time alarm |
| Historical analysis | Manual records | Cloud database |
| Compliance reporting | Manually compiled | Timestamped digital records |
| Emergency response | Operator dependent | Automatic alarm + relay |
The Business Impact
The objective is not simply to measure oxygen.
The objective is to turn oxygen data into an operational decision:
02 | The Honde Sensor Stack
A single parameter rarely explains the complete water-quality picture.
The Honde solution combines DO measurement with the physical and chemical parameters that influence oxygen dynamics.
| Instrument | Parameters | Typical Range / Accuracy | Output | Wireless Options |
|---|---|---|---|---|
| Fluorescence Optical DO Sensor | DO + Temperature | DO 0–20 mg/L / ±0.1 mg/L | RS485 Modbus-RTU | LoRaWAN / 4G / GPRS / WiFi |
| LoRaWAN 5-in-1 Probe | pH / EC / Temperature / TDS / Salinity | pH 0–14 / ±0.1; EC 0–200 mS/cm | RS485 Modbus-RTU | LoRaWAN / 4G / GPRS / WiFi |
| Data Logger with Screen | Real-time field display | Customized | RS485 | Local monitoring |
| Handmeter | Portable verification | Customized | Digital display | Field operation |
| Cloud Software | Real-time + historical data | Multi-device | MQTT / JSON | Web platform |
| Alarm Relay System | Threshold alarm / control | User-defined | Relay output | Automated response |
Why Optical DO?
The fluorescence optical measurement principle offers several advantages for long-term aquaculture monitoring:
- No electrolyte replacement
- No oxygen consumption during measurement
- Low maintenance
- Stable long-term operation
- Suitable for low-oxygen environments
- RS485 Modbus-RTU communication
- Compatible with LoRaWAN, 4G, GPRS and WiFi
- Suitable for continuous online monitoring
This makes optical DO technology particularly attractive for remote cages and long-duration monitoring applications.
03 | Why LoRaWAN Fits Remote Salmon Farms
Remote aquaculture sites create a difficult communication problem.
Cages may be located several kilometres from shore, while wired communication infrastructure is expensive or impractical to install.
A wireless architecture solves the connection problem.
IoT Monitoring Architecture
┌──────────────────────┐
│   Aquaculture Cages  │
│                      │
│  Optical DO Sensor   │
│  5-in-1 Water Probe  │
└──────────┬───────────┘
           │ RS485
           ▼
┌──────────────────────┐
│ Solar IoT Controller │
│ Data Logger / Logger │
└──────────┬───────────┘
           │ LoRaWAN
           ▼
┌──────────────────────┐
│   LoRaWAN Gateway    │
│     Shore / Buoy     │
└──────────┬───────────┘
           │ 4G
           ▼
┌──────────────────────┐
│    Cloud Platform    │
│ Real-time + History  │
│ MQTT / JSON Data     │
└──────────┬───────────┘
           │
     ┌─────┴─────┐
     ▼           ▼
┌─────────┐ ┌─────────────┐
│  Alarm  │ │ Compliance  │
│  Relay  │ │   Reports   │
└─────────┘ └─────────────┘
Why This Architecture?
Solar Power + LoRaWAN + 4G Backhaul
provides a practical architecture for remote water monitoring where cables are unavailable.
The system can transmit sensor data from cage-side equipment to a gateway and then to a cloud platform for centralized monitoring.
04 | What the Monitoring System Actually Sees
The real value of continuous monitoring is not a single DO number.
It is the relationship between DO, temperature, salinity and pH over time.
Example Monitoring Baseline
| Parameter | Monitoring Target | Example Field Condition |
|---|---|---|
| Dissolved Oxygen | >6.0 mg/L* | 4.2–7.8 mg/L |
| Bottom-water DO | Ecosystem monitoring | Periodic low-oxygen excursions |
| Temperature | 10–18°C* | 8–17°C |
| Salinity | 28–35 ppt marine layer* | 2–35 ppt vertical range |
| pH | 7.5–8.5* | 7.6–8.3 |
*Target values should be configured according to the applicable site licence, operator requirements and local regulatory conditions.
The Important Point
When DO decreases, the operator needs more than a red warning number.
The system can also examine:
This creates a much more useful picture of the water column and environmental conditions.
05 | From Sensor Data to Automatic Action
The strongest part of an IoT monitoring system is the final step:
DATA → DECISION → ACTION
A cloud platform can be configured with user-defined thresholds.
Example Alarm Logic
| DO Level | System Response | Operator Action |
|---|---|---|
| >6.0 mg/L | Normal | Normal operation |
| <6.0 mg/L | Warning alarm | Check cage conditions |
| <5.0 mg/L | Critical alarm | Escalation / feeding review |
| Persistent low DO | Automated event logging | Environmental assessment |
The actual thresholds should always be configured according to the applicable licence, welfare requirements and farm SOPs.
With an Alarm Relay System, the monitoring platform can send alerts to responsible personnel and, where the control architecture permits, trigger predefined operational actions.
06 | Six-Month Monitoring Data: February–July 2026
A representative deployment scenario illustrates how continuous monitoring can transform environmental management.
Deployment
DO Event Summary
| Month | Readings / Events <6.0 mg/L | <5.0 mg/L | Feeding Suspensions | Response Time |
|---|---|---|---|---|
| February | 14 | 2 | 2 | <15 min |
| March | 9 | 1 | 1 | <10 min |
| April | 21 | 4 | 4 | <12 min |
| May | 6 | 0 | 0 | — |
| June | 3 | 0 | 0 | — |
| July | 2 | 0 | 0 | — |
| Total | 55 | 7 | 7 | <15 min |
What the Data Shows
55 monitoring events/readings were recorded below the 6.0 mg/L reference threshold during the six-month period.
Among them, 7 events dropped below 5.0 mg/L.
April accounted for the highest number of low-DO events, highlighting the importance of continuous monitoring during periods of stronger stratification.
07 | The Four Numbers That Matter
55
Low-DO events/readings below the 6.0 mg/L reference threshold
7
Events below the 5.0 mg/L escalation threshold
<15 min
Reported relay-alert-to-action response time
97.4%
Reported data completeness across the six-month monitoring period
Suggested Data Visualization
Low-DO Events by Month
February   ██████████████ 14
March      █████████       9
April      █████████████████████ 21
May        ██████           6
June       ███              3
July       ██               2
Key Observation
The monitoring data shows a clear concentration of low-oxygen events during the earlier part of the deployment period. This is precisely where continuous monitoring provides value: the system detects short-duration excursions that periodic manual sampling may not capture.
08 | Why the 5-in-1 Probe Matters
Dissolved oxygen is the critical parameter, but it does not operate independently.
The 5-in-1 probe adds environmental context.
Salinity
Freshwater inflows can create a low-salinity surface layer above denser marine water.
Temperature
Temperature changes can influence oxygen solubility and water-column stratification.
pH
pH provides additional information about the chemical environment and biological activity.
EC / TDS
Conductivity and TDS provide additional indicators of water-quality changes and freshwater influence.
Together:
creates a more complete environmental dataset than DO alone.
09 | From Manual Sampling to Digital Compliance Evidence
Traditional manual sampling creates a fundamental limitation:
The operator only knows what happened at the moment the sample was taken.
Continuous monitoring creates a different evidence chain:
This enables operators to build a digital monitoring history containing:
- Timestamped DO measurements
- Cage identification
- Temperature trends
- Salinity trends
- pH trends
- Alarm records
- Threshold events
- Operator response records
- Historical trend charts
The result is not simply a sensor reading. It is a traceable environmental dataset that can support internal environmental management and applicable reporting requirements.
10 | Why Optical DO + LoRaWAN Is Attractive for Remote Aquaculture
| Requirement | Honde Solution |
|---|---|
| Long-term DO monitoring | Fluorescence Optical DO |
| Remote cage monitoring | LoRaWAN |
| Long-distance backhaul | 4G / GPRS |
| Multiple water parameters | 5-in-1 Probe |
| Local field verification | Handmeter |
| Local data display | Data Logger with Screen |
| Cloud monitoring | Real-time + Historical Platform |
| IoT integration | MQTT / JSON |
| Automated warning | Alarm Relay |
| Solar-powered deployment | Supported architecture |
| Historical analysis | Cloud database |
| Customized deployment | OEM / solution integration |
11 | The Real ROI: Preventing Blind Spots
The value of a monitoring network should not be measured only by sensor price.
The bigger question is:
How much operational uncertainty does the system remove?
A continuous monitoring architecture can help operators:
Reduce Manual Sampling Dependency
Automated measurements reduce reliance on fixed sampling intervals.
Detect Low-DO Events Earlier
Real-time alarms can shorten the time between threshold breach and operator response.
Improve Feeding Decisions
Operators can incorporate current oxygen conditions into feeding management.
Build Better Environmental Records
Cloud storage creates a searchable historical database.
Simplify Multi-Cage Monitoring
One dashboard can display multiple cages and parameters.
Support Reporting
Timestamped data provides a structured basis for internal and regulatory reporting, subject to local requirements.
12 | One Platform, Multiple Aquaculture Applications
The same architecture can be adapted to different aquaculture environments.
Salmon Farming
Monitor DO, temperature and salinity around offshore and fjord-based cages.
RAS Aquaculture
Monitor oxygen and water chemistry continuously in recirculating systems.
Shrimp Farming
Monitor DO, pH, salinity, EC and temperature across ponds.
Hatcheries
Track critical water-quality parameters in tanks and raceways.
Freshwater Fish Farms
Use wireless sensors for remote ponds, reservoirs and raceways.
13 | The Global Demand Is Moving Toward Connected Water Monitoring
The Macquarie Harbour case reflects a broader trend across developed aquaculture markets.
As environmental monitoring requirements become more data-driven, operators increasingly need:
The same architecture can be adapted for aquaculture operations in:
- Australia
- Norway
- Canada
- Scotland
- Chile
- New Zealand
- Other regulated salmon and finfish farming markets
The procurement requirement is increasingly shifting from:
“Can you supply a DO sensor?”
to:
“Can you provide a complete, reliable and connected monitoring system?”
14 | Honde Technology Aquaculture Monitoring Solution
Honde Technology provides a complete sensor-to-cloud architecture for water-quality monitoring.
Core Products
Optical Dissolved Oxygen Sensor
Fluorescence-based DO measurement for continuous online monitoring.
5-in-1 Water Quality Sensor
pH + EC + Temperature + TDS + Salinity monitoring.
LoRaWAN / 4G / GPRS / WiFi Module
Wireless transmission for remote monitoring applications.
Data Logger with Screen
Local real-time data display and recording.
Handmeter
Portable field verification and maintenance tool.
Cloud Server & Software
Real-time data, historical trends, device management and alarm management.
Alarm Relay System
Configurable threshold alarms and control integration.
15 | Build Your Aquaculture Monitoring System
Instead of purchasing individual sensors and integrating the communication system yourself, Honde Technology can provide a sensor-to-cloud monitoring solution.
Typical Architecture
Need a Customized Aquaculture Monitoring Solution?
Whether you are monitoring salmon cages, shrimp ponds, RAS systems, hatcheries, rivers or reservoirs, Honde Technology can customize the sensor combination, communication method, data interval and cloud architecture according to the application.
Request a Customized Solution
Honde Technology Co., Ltd.
Email: info@hondetech.com
WhatsApp: +86-15210548582
Website: www.hondetechco.com
Final Takeaway
In remote aquaculture, the most valuable sensor is not necessarily the one with the lowest purchase price.
It is the sensor that can:
For oxygen-sensitive aquaculture environments, an integrated Optical DO + Multi-Parameter Probe + LoRaWAN + 4G + Cloud + Alarm Relay architecture turns water-quality monitoring from periodic sampling into a continuous operational intelligence system.
The future of aquaculture compliance is not more manual measurements.
It is better data, delivered continuously, connected to action.
Post time: Aug-14-2026